Dashboard
PinchTab includes a built-in web dashboard for monitoring instances, managing profiles, and editing configuration.
The dashboard is part of the full server:
pinchtaborpinchtab serverstarts the full server and serves the dashboardpinchtab bridgedoes not serve the dashboard
You can open the dashboard at:
http://localhost:9867http://localhost:9867/dashboard
[!WARNING] The dashboard is an operator/admin control surface, not a public or multi-user application. Do not expose it to untrusted users. Anyone who can use the dashboard can manage profiles, instances, configuration, and other browser-control capabilities that are enabled on that server.
Dashboard overview
The current dashboard exposes three main pages:
- Monitoring
- Profiles
- Settings
The UI is a React SPA served by the Go server.
Monitoring page
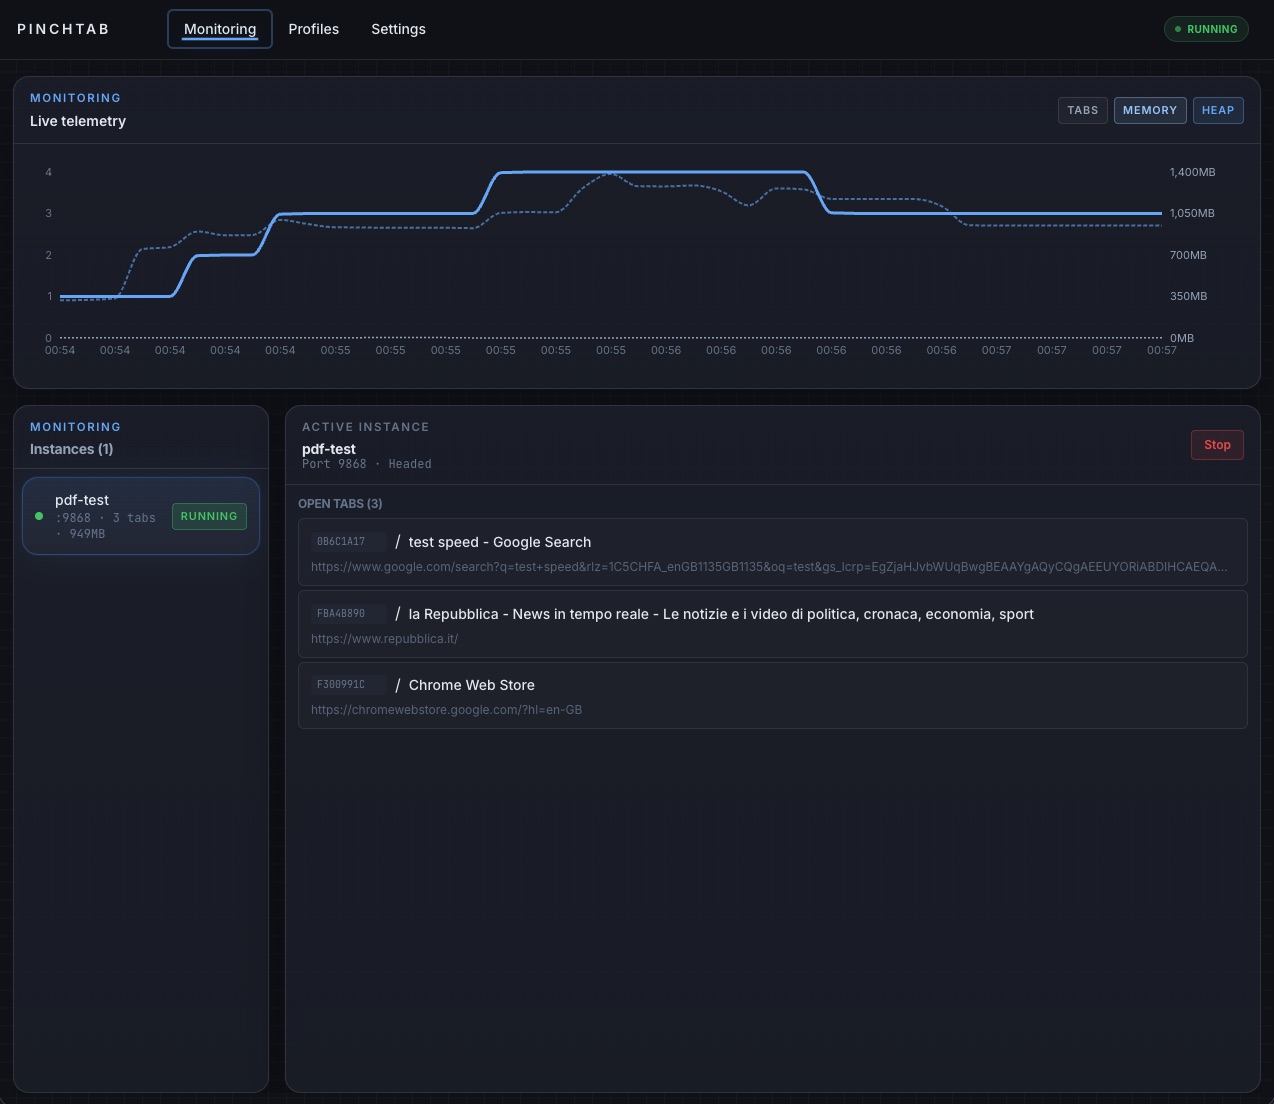
The Monitoring page is the default view.
It shows:
- running and stopped instances
- selected-instance details
- open tabs for the selected instance
- charted monitoring data
- optional memory metrics when enabled in settings
What you can do:
- select an instance
- inspect its port, mode, and status
- view its open tabs
- stop a running instance
Operational data comes from:
- SSE updates on
GET /api/events - instance lists from
GET /instances - tab data from
GET /instances/{id}/tabs - optional memory data from
GET /instances/metrics
Profiles page
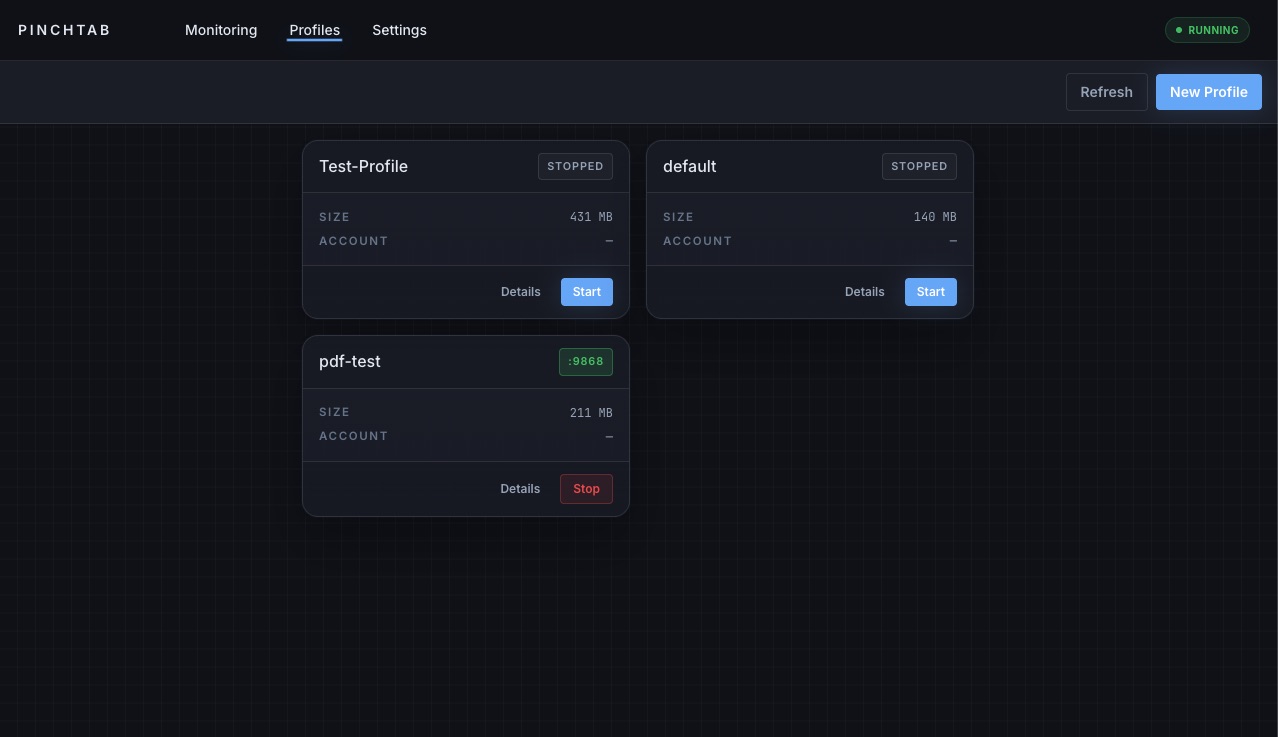
The Profiles page manages saved browser profiles.
It shows:
- available profiles
- launch and stop actions
- profile metadata such as name, path, size, source, and account details
What you can do:
- create a new profile
- launch a profile as a managed instance
- stop the running instance for a profile
- edit profile metadata
- delete a profile
- open a profile details modal
The launch flow uses the server APIs behind the scenes:
curl -X POST http://localhost:9867/profiles \ -H "Content-Type: application/json" \ -d '{"name":"work","useWhen":"Team account workflows"}'
curl -X POST http://localhost:9867/profiles \ -H "Content-Type: application/json" \ -d '{"name":"work","useWhen":"Team account workflows"}'
{
  "status": "created",
  "id": "prof_278be873",
  "name": "work"
}pinchtab instance start --profile prof_278be873 --mode headedcurl -X POST http://localhost:9867/instances/start \ -H "Content-Type: application/json" \ -d '{"profileId":"prof_278be873","mode":"headed"}'
{
  "id": "inst_ea2e747f",
  "profileId": "prof_278be873",
  "profileName": "work",
  "port": "9868",
  "mode": "headed",
  "headless": false,
  "status": "starting"
}
Profile details modal
Profile details are shown in a modal, not as a separate top-level page.
The modal currently includes tabs for:
- Profile
- Live
- Logs
From there you can:
- view the profile ID and metadata
- edit name and
useWhen - inspect live tabs for a running instance
- open a screencast tile for tab previews
Settings page
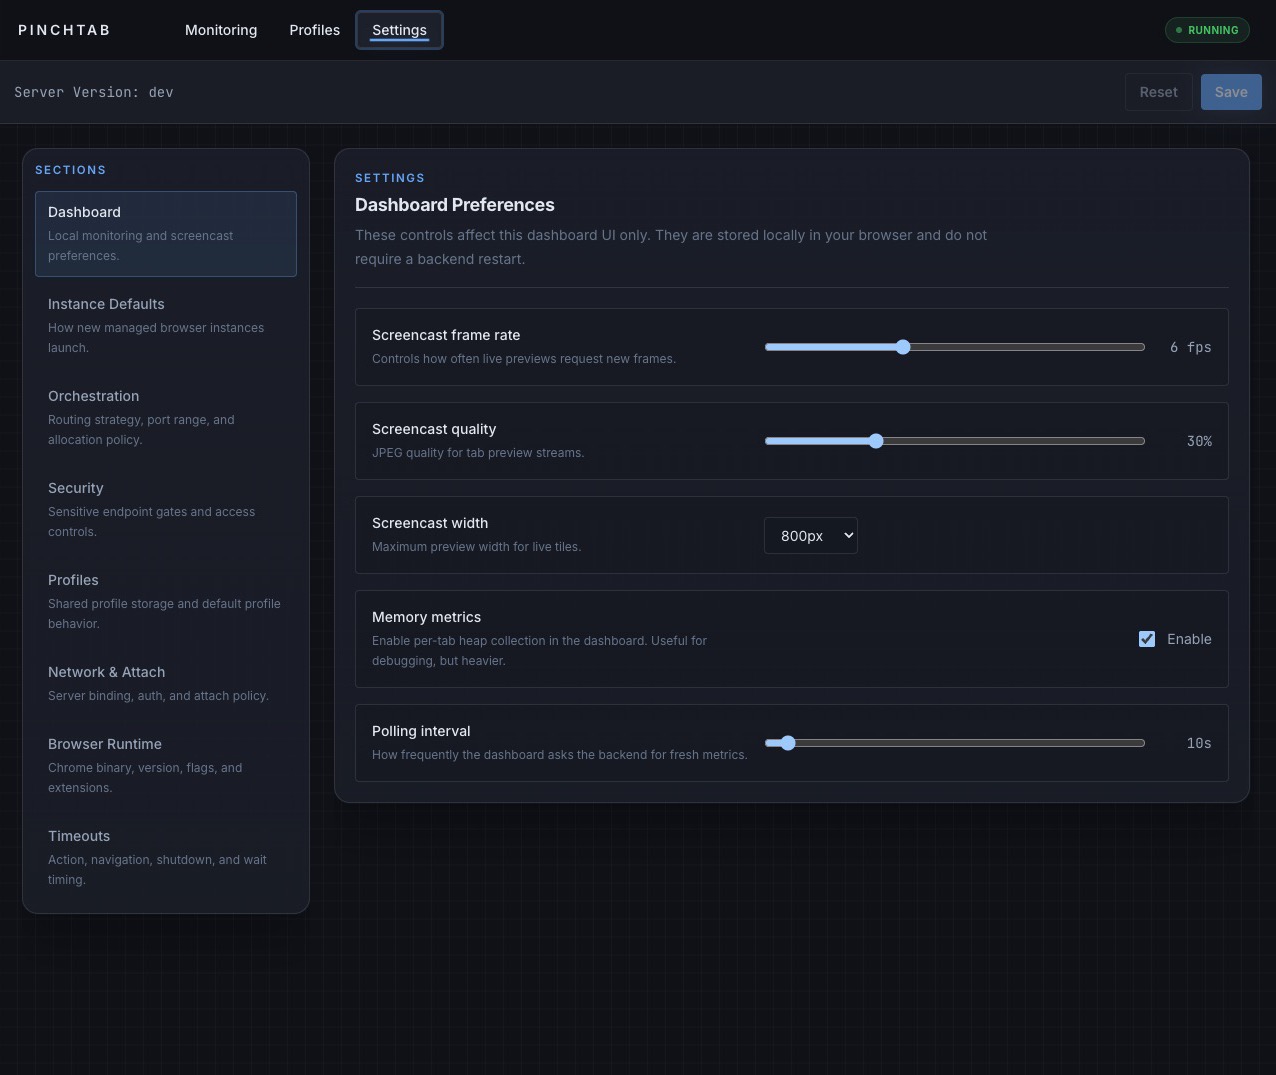
The Settings page combines local dashboard preferences with backend configuration.
It includes sections for:
- Dashboard
- Instance Defaults
- Orchestration
- Security
- Security IDPI
- Profiles
- Network & Attach
- Browser Runtime
- Timeouts
What you can do:
- change local dashboard preferences such as monitoring and screencast settings
- load backend config from
GET /api/config - save backend config through
PUT /api/config - see whether a restart is required for server-level changes
The Security section now includes:
security.allowedDomainsfor the website allowlist used by IDPI domain checkssecurity.trustedProxyCIDRsfor known internal proxies whose runtime remote IPs should be trustedsecurity.trustedResolveCIDRsfor operator-controlled DNS or proxy setups where hostnames intentionally resolve to non-public IPs
The Security IDPI section is focused on content-protection behavior:
security.idpi.enabledsecurity.idpi.strictModesecurity.idpi.scanContentsecurity.idpi.wrapContentsecurity.idpi.customPatterns
The health payload also surfaces summary info:
curl http://localhost:9867/health | jq .curl http://localhost:9867/health | jq . {
"status": "ok",
"mode": "dashboard",
"profiles": 3,
"instances": 1,
"agents": 0,
"restartRequired": false
}Event stream
The dashboard uses Server-Sent Events, not WebSockets.
Primary stream endpoint:
curl http://localhost:9867/api/eventscurl http://localhost:9867/api/events This stream carries:
initactionsystemmonitoring
Build note
If the React dashboard assets are not built into the binary, the server serves a fallback page telling you to build the dashboard bundle.
Troubleshooting
Dashboard not loading
curl http://localhost:9867/healthcurl http://localhost:9867/health If the server is up, try:
http://localhost:9867http://localhost:9867/dashboard
No instances visible
Start one:
pinchtab instance startcurl -X POST http://localhost:9867/instances/start \ -H "Content-Type: application/json" \ -d '{"mode":"headless"}'
No live profile preview
The profile must have a running instance before the Live tab in the profile details modal can show live tab data.